Audio peaking:
Does a high peak mean clipping?
Audio peaking means the signal reaches a high point; a peak reading alone does not prove that the recording clipped. Before applying a repair, identify where the level was measured and compare the unprocessed source, export history and waveform around the suspect passage. Turning a previously clipped file down can remove today's rail contacts without undoing the earlier flattening. Conversely, a sine normalized to a representable limit can touch that limit without a clamping operation.
Download the peak-evidence decision worksheet (CSV)
The same peak can hide a different history
Measurements collected and repeated on October 10, 2026, on a Windows test machine. We generated a C5 sine and constructed four PCM variants, then passed each through this site's unchanged Balanced detector. This is a synthetic, code-level experiment—not a microphone recording, listening test or observed meter display.
| Input construction | Sample peak (dBFS) | Rail samples | Longest equal-peak run | Detected MIDI |
|---|---|---|---|---|
| Clean sine → half scale No clamping | −6.020600 | 0 | 1 sample | 1 event · pitch 72 |
| Clean sine → positive rail No clamping | −0.000265 | 116 | 1 sample | 1 event · pitch 72 |
| Hard clamp → half scale Known injected clipping | −6.020600 | 0 | 36 samples | 1 event · pitch 72 |
| That clipped PCM → half its level No new clamping | −12.041200 | 0 | 36 samples | 1 event · pitch 72 |
The first and third files both peak at exactly 16,384 integer counts, or 0.5 on our normalized sample scale. Neither contains a sample at today's signed 16-bit rails. Yet the third was deliberately clamped before its level was set. An equal peak and a zero rail count cannot distinguish these two known histories.
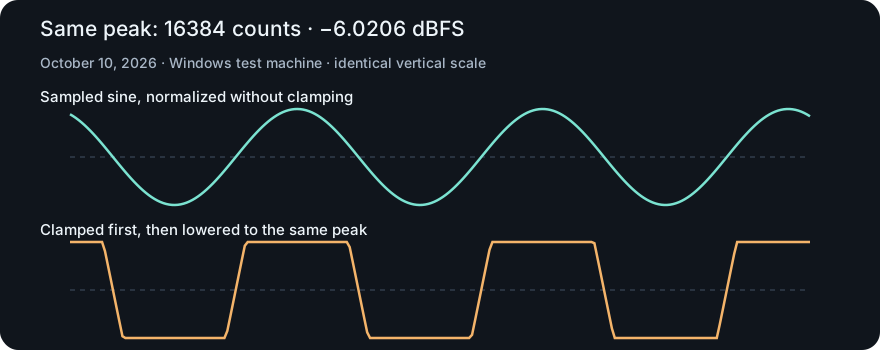
Reducing the clipped file again changed its peak from 16,384 to 8,192 counts. The longest equal-peak run stayed at 36 samples. This is a measured example of lower level without removal of the constructed flattening, not a listening judgment about whether that audio is acceptable.
The second file makes the opposite mistake visible: normalization without clamping produced 116 samples equal to the positive integer rail, with no consecutive equal-peak run longer than one sample. Those contacts are not evidence that our construction previously exceeded a recording limit. Rounding and known normalization history matter. Neither 116 contacts nor a run of 36 is a recommended diagnostic cutoff for your audio.
Record evidence before choosing a repair
The downloadable worksheet separates untested recommendations, the four measured cases, and a blank row for your file. Leave unknown fields blank. A red light, a high sample peak and an audible distortion are different observations; do not silently substitute one for another.
| What you have | What it establishes | Next check |
|---|---|---|
| Only a peak number or indicator | A level or threshold at that measurement point—not the complete signal history | Record the file, channel, selection, units and meter position. Preserve the untouched take. |
| A below-rail export | The current stored samples do not reach that rail; earlier overload remains possible | Compare an earlier source/export and inspect the same passage. Do not issue a clean bill from the maximum alone. |
| Rail contacts after normalization | The normalized file reaches a limit; the count alone does not identify an earlier recording overload | Check how the file was made. Separate gain adjustment from a clamp or limiter. |
| Distortion remains when level is lowered | A level-only change has not demonstrated sound reconstruction | Compare with a clean reference on a copy. If clipping is established, use the separate repair-versus-rerecord decision table. |
- Name the measurement point. Is it the saved file's sample maximum, an input indicator, or a meter after a level control? Our test measures saved PCM, not an interface or DAW meter. A downstream number cannot by itself describe what happened earlier.
- Hold the passage and channel fixed. Compare the unprocessed take and export at the same location. Do not compare one file's whole-track peak with another file's quiet excerpt and call that recovery.
- Inspect local shape and provenance together. Repeated flat values are useful clues in our constructed pair, but compression, limiting, synthesis, quantization and later processing can complicate an unknown file. If the source history is unavailable, record that uncertainty instead of diagnosing from one statistic.
- Separate audio acceptance from note acceptance. A usable MIDI draft does not approve recorded sound. Test a short phrase in the converter only when it is the notes you need, and verify pitch and boundaries against a reliable source.
What happened to the note draft?
All four outputs contain one MIDI pitch-72 event, starting at zero with detected duration 1.3003174603174603 seconds and velocity 118. Each WAV lasts 1.500 seconds. All MIDI files are the same 42 bytes, with SHA-256 d4c965a088a9165605137748a537574ec24cd401b4f826444902e76b5b8fa537. That is a secondary detector observation, not proof of timing fidelity, waveform restoration or successful transcription of clipped music.
Our equal-peak pair also differs in RMS: 0.352292285621 for the clean file versus 0.471828701986 for the clamped file, on the normalized sample scale. Matching the peaks did not match their RMS or establish equal perceived loudness. This is deliberately not a loudness-matched listening comparison.
Download the exact comparison
- Peak-evidence decision worksheet (CSV)
- Clean half scale: WAV input · MIDI output
- Clean rail normalization: WAV input · MIDI output
- Clamped, then half scale: WAV input · MIDI output
- Clamped PCM, lowered again: WAV input · MIDI output
- Exact observations and every PCM/WAV/MIDI hash · Reproduction script
Method and boundaries
Each file contains 66,150 mono frames at 44,100 Hz, signed 16-bit PCM, and is 132,344 bytes. The generated frequency is 523.2511306011972 Hz with 8 ms linear edges. We normalized the sampled sine by its measured maximum magnitude, then rounded it to peaks of 16,384 or 32,767 counts without clamping. For the known clipped case, we multiplied that normalized sine by four, clamped to −1/+1, then scaled and rounded to 16,384 counts. The last case divides those clipped PCM integers by two and rounds.
Our normalized scale is integer sample ÷ 32,768. Sample peak dBFS = 20 × log10(maximum absolute integer ÷ 32,768). Thus 16,384 ÷ 32,768 = 0.5 gives −6.0205999133 dBFS; 8,192 ÷ 32,768 = 0.25 gives −12.0411998266 dBFS. Positive 32,767 gives −0.0002650764 on this explicit scale; a meter may round or label full scale differently. These are sample peaks, not reconstructed intersample/true peaks, physical volts or an audibility threshold.
“Rail samples” counts values exactly +32,767 or −32,768. “Longest equal-peak run” counts consecutive identical signed samples whose absolute value equals that file's measured maximum. It is a descriptive statistic for these fixtures, not a clipping detector for all recordings. The record retains full precision and fingerprints; SHA-256 checks byte identity, not sound quality.
We parsed the WAV integers into Float32 arrays and called the unchanged production mixToMono, downsample, detectNotes and buildMidi functions, using Balanced mode. The same-day repeat reproduced all four WAV and four MIDI hashes. In this site's project, run node tests/audio-peaking-research.mjs --check; the downloadable script expects the project layout and is not a standalone repair application.
Audacity's Normalize documentation describes setting a peak level; its separate Clip Fix documentation describes attempted interpolation with limited applicability. We did not run either effect in this comparison. Scaling the constructed PCM down is not a measured repair.
No browser decoding, file-picker conversion, listening, microphone, DAW meter, real performance, true-peak measurement, de-clipping output or commercial-tool comparison was measured. Four synthetic files cannot establish a universal pass/fail limit, the prevalence of clipping, or how any unknown recording was made. The new contribution is this dated equal-peak dataset and its worksheet—not a claim that no other English page discusses peaks.
If the waveform is displaced rather than flattened, use the regional DC-offset check. If pitch and speed both shifted, check the sample-rate label. These are separate investigations. Once clipping is established, keep its repair decision separate from this evidence-gathering step.